Product Analytics can help you acquire more users, keep them longer, and increase revenue.
This guide shows you how.
Product Analytics: A Quick Primer
Companies use product analytics to analyze user behavior and optimize their products. Knowing what your users are doing and why they’re doing it lets you redesign your app to encourage more of the behaviors you want.
Want to increase signups or drive more purchases? Need your users to spend more money or refer more friends? Product analytics can give you the insights to make it happen.
Product analytics tools gather data about what your users are doing and where on your site or app they’re doing it. You can use the data these tools generate to answer questions like:
- Where are users getting stuck in the signup or checkout process?
- What actions are most likely to lead to users sticking around and coming back week after week?
- Which users generate the most revenue for the company, and how do we get more users like these?
If these sound like the types of questions you’d like to answer, you’ll need to pick a product analytics tool to gather user data and help you analyze it.
Event-Based Product Analytics Tools
Most product analytics tools are based on the concept of tracking events.
An event is any single action a user takes. Signing up, clicking a button, and completing a purchase are all common events these tools track.
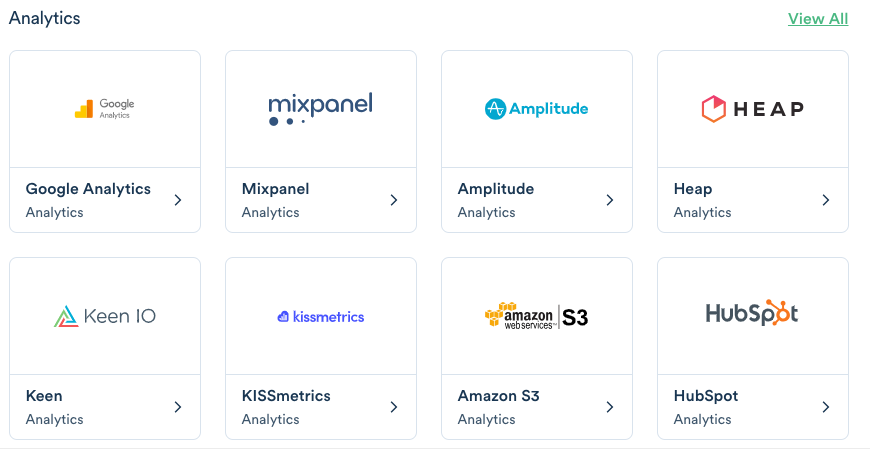
There are hundreds of event-based product analytics tools to choose from, but these are the most popular and most useful.
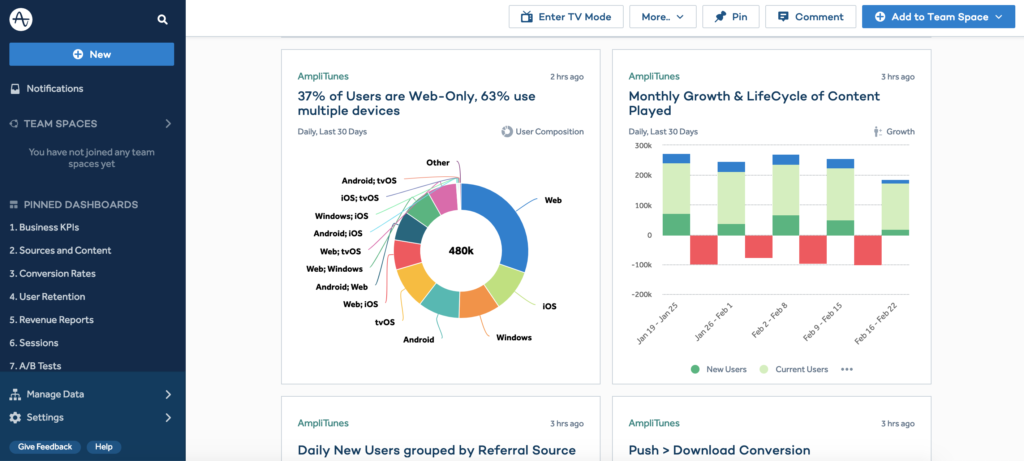
Amplitude
Amplitude is a fantastic event-based tool. It includes all the common reports you’d expect: funnel charts, retention charts, customer lifetime value reports, and user cohorts.
Amplitude is easy to set up and use. Simply install the JavaScript snippet, define some events, and create charts in the Amplitude dashboard.
Amplitude offers a generous free tier that tracks 10 million events per month. This is plenty for all but the largest user bases.
You can invite as many colleagues as you like to create and view reports. While the free tier doesn’t include a few advanced charts, you probably won’t miss them. Unless you manually delete it, Amplitude will save user data history forever. This means you don’t have to worry about losing precious insights after a few months go by.
I recommend Amplitude for most projects. It’s a comprehensive tool that works well for both web and mobile apps.
Mixpanel
Mixpanel is probably the most well-known event-based analytics tool.
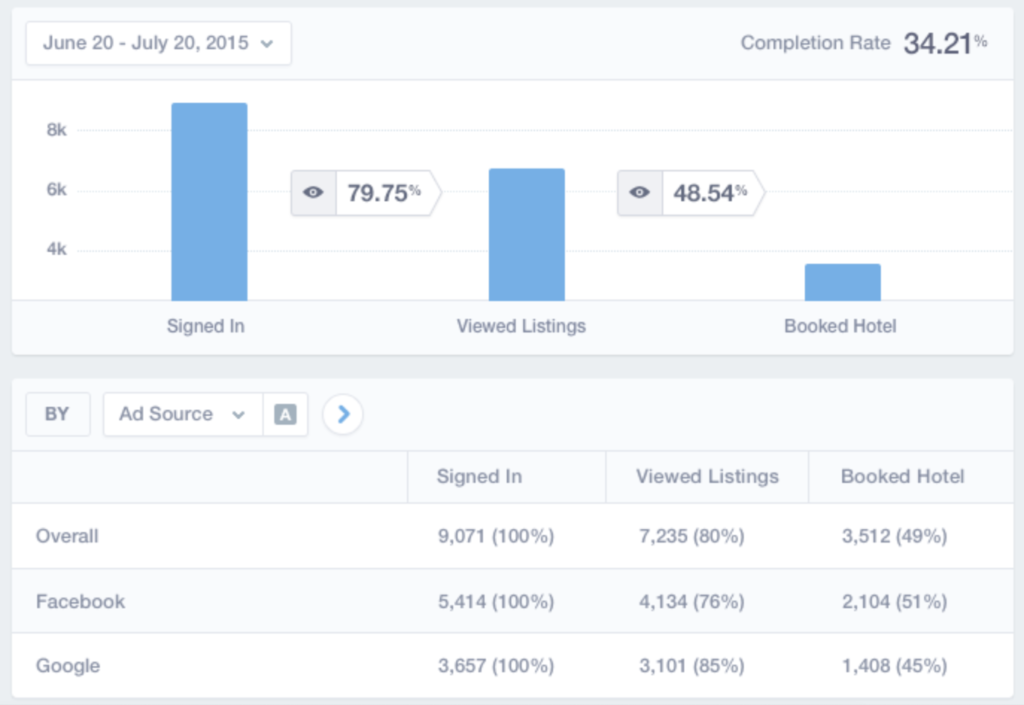
Like Amplitude, Mixpanel offers all the standard reports you’d expect. Mixpanel organizes its reports and tools into two groups: engagement tools and people tools.
Mixpanel’s engagement tools focus on analyzing the actions people take in your application.
The people tools focus on analyzing and re-engaging specific users; they include some additional reports and tools for A/B testing and sending push notifications. While these tools are nice, they’re a bit simplistic. Mixpanel can’t serve as a true substitute for full A/B testing suites or user engagement applications.
Mixpanel’s free tier is limited. While you can track 5 million events per month, Mixpanel only keeps the data for 60 days. You can only invite 2 colleagues to collaborate. Mixpanel limits your people tools usage to the first 1000 users.
Paid plans remove these limitations, but start at $999/month.
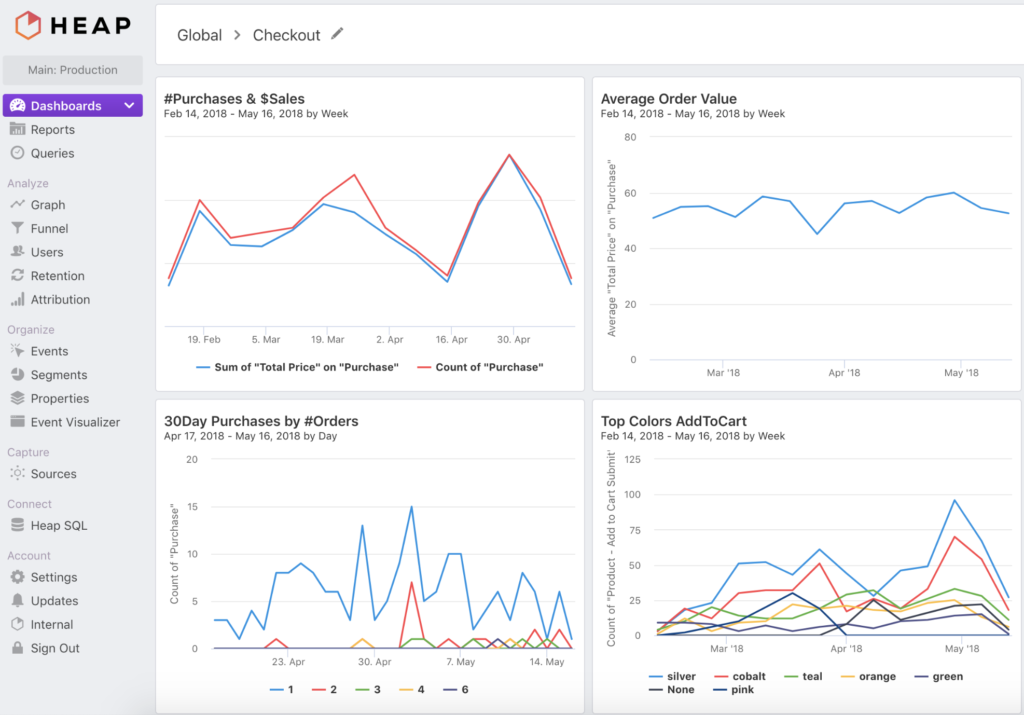
Heap Analytics
Heap Analytics works a bit differently. Unlike the other tools, Heap doesn’t require you to define the events you want to track ahead of time.
Instead, Heap will track everything your users do and you can define events later. This might seem useful, but there are strategies for setting up the other tools that make this unnecessary. (See the Data Taxonomy section below.)
Heap offers the same types of reports Amplitude and Mixpanel offer. Unfortunately, Heap’s free tier only includes 5000 user sessions per month, and Heap only keeps your data for 3 months.
Heap is a great choice for teams without engineers. Otherwise, Amplitude is the clear winner.
Other Product Analytics Tools
The product analytics tools above are by far the most popular, but here are a few others you should know.
Segment
Segment is a data platform that makes implementing 3rd-party tools easier.
You send your data to segment, and Segment sends it to your tools. This adds an extra step, but it’s incredibly useful. Instead of implementing each tool manually, you can turn tools on and off with the click of a button.
The downside of Segment is that it can get expensive at scale. The free plan only includes 1000 monthly tracked users; beyond that, you’ll need to pay.
Google Analytics
If you’ve worked in web development for a while, you’ve probably heard of Google Analytics (GA).
Google launched GA in 2005 as a free tool to track ecommerce and blogging websites. While GA has evolved since then, it remains true to those roots. Event tracking is a limited, second-class citizen; funnel reports and user cohorts aren’t especially comprehensive or easy to use.
Some ecommerce and blogging companies still choose GA as their primary analytics tool because it’s well-suited for those use cases.
But for most mobile apps and non-ecommerce websites, GA is a poor choice. You’ll spend too much time fighting the tool and too little analyzing user behavior or redesigning your product.
FullStory
FullStory is the most unique tool on this list; it actually lets you watch users interact with your app.
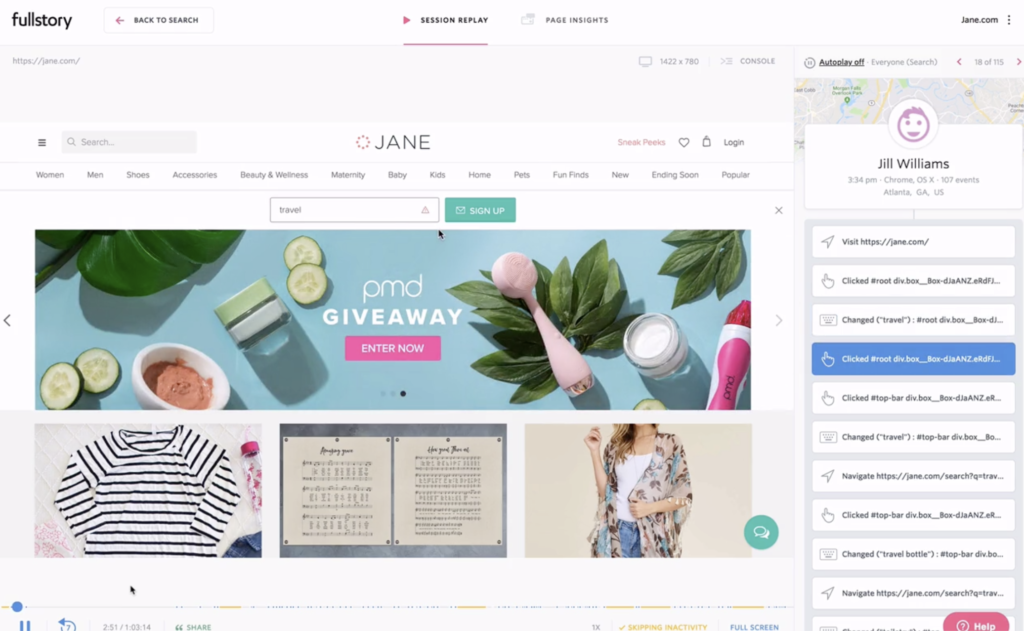
Simply add the JavaScript snippet to your site and start watching your users as if you’re looking over their shoulders. This is incredibly useful if you want to see where users are struggling.
I recommend considering FullStory as a secondary tool and using it in combination with Amplitude or Heap.
Data Taxonomy: Naming Product Analytics Events & Properties
Once you pick a tool, you’ll need to set it up.
After installing your tool’s tracking code, you’ll want to follow a few best practices.
Use Generic Events First
It’s tempting to start creating events immediately, but a bit of planning will save you time and headaches later.
I recommend starting with a few generic events:
- Viewed Page – Fire this event when a user views a page or screen.
- Clicked Button – Fire this event when a user clicks a button.
- Clicked Link – Fire this event when a user clicks a link.
For each of these events, include the url and text label as properties on the event (see below). Creating these generic events in Amplitude or Mixpanel will give you most of the same “set it and forget it” benefits as Heap Analytics.
You’ll likely want to add a few custom events for key behaviors in your app. Events like Signed Up and Placed Order are useful additions, but implementing these 3 generic events first will cover 95% of your needs.
Follow a Verb + Object Syntax
You’ll also need to decide on a naming syntax for your events. While there are many ways to name events, I recommend following a verb + object convention.
Events names like Viewed Page and Placed Order are clear and concise. The fact that a user is doing this is implied.
By naming every event consistently, you’ll keep your data organized. This makes it easy to navigate your tool and find what you’re looking for quickly.
Load Up on Properties
Properties are extra pieces of information you can include with each event.
For example, you could use a property on the Clicked Button event to specify the text label of the button. If you wanted, you could include another to specify the color.
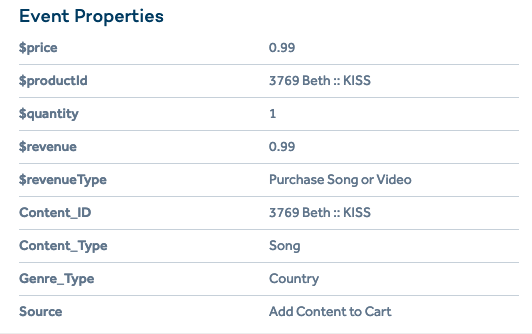
Your tool includes a few default properties with every event like user_id and url, but you’ll likely want to add more. Luckily, the tools above place very few limits on properties. Take advantage of this and include properties for any information you may need later.
For more suggestions on organizing your event data, check out Amplitude’s excellent Data Taxonomy Playbook.
Getting the Most out of Your Product Analytics Data
Now that you have all this data, you’ll need to use it improve your product. Here are a few tips for getting the most from your product analytics data:
- Ensure Your Data is Reliable – Accurate data is crucial. After you set up your tool, test it out and make sure the appropriate events are firing. Check this regularly to ensure everything is in good shape.
- Learn Funnel Analysis – Good tools and accurate data mean nothing if you don’t know what it all means. Learn how to identify and optimize the key parts of your product with funnel analysis.
- Evangelize Your Data – All this data is worthless if nobody is using it. Help your organization become data-driven by evangelizing product analytics within your team.
Want More? This article is part of the UX Engineer Playbook series.