Averages make very poor benchmarks.
I get it. You want to know what typical acquisition, activation, and referral rates look like. You want this information as a signpost to evaluate your own product’s performance.
But there are two huge problems with comparing your product to the average:
1. Not All Products Are Alike
This issue should be obvious, but it bears repeating.
Products in different industries perform differently. Communication apps will have different activation rates than tax products.
Products with different business models perform differently. Subscription e-commerce is drastically different than traditional e-commerce.
And products with different cost structures perform differently. Don’t expect the same retention rate from your $25/yr. SMB product and your $1M/yr. enterprise SaaS product.
2. The Top Products Far Outperform the Rest
Less obvious, though, is the fact that the top products and companies—even when controlling for industry, business model, and cost structure—far outperform the average.
In fact, top companies perform as much as 500% better than average!
Sound crazy? Let’s take a look at the data. Here’s a list of e-commerce conversion rates by product type, courtesy of MarketingSherpa:
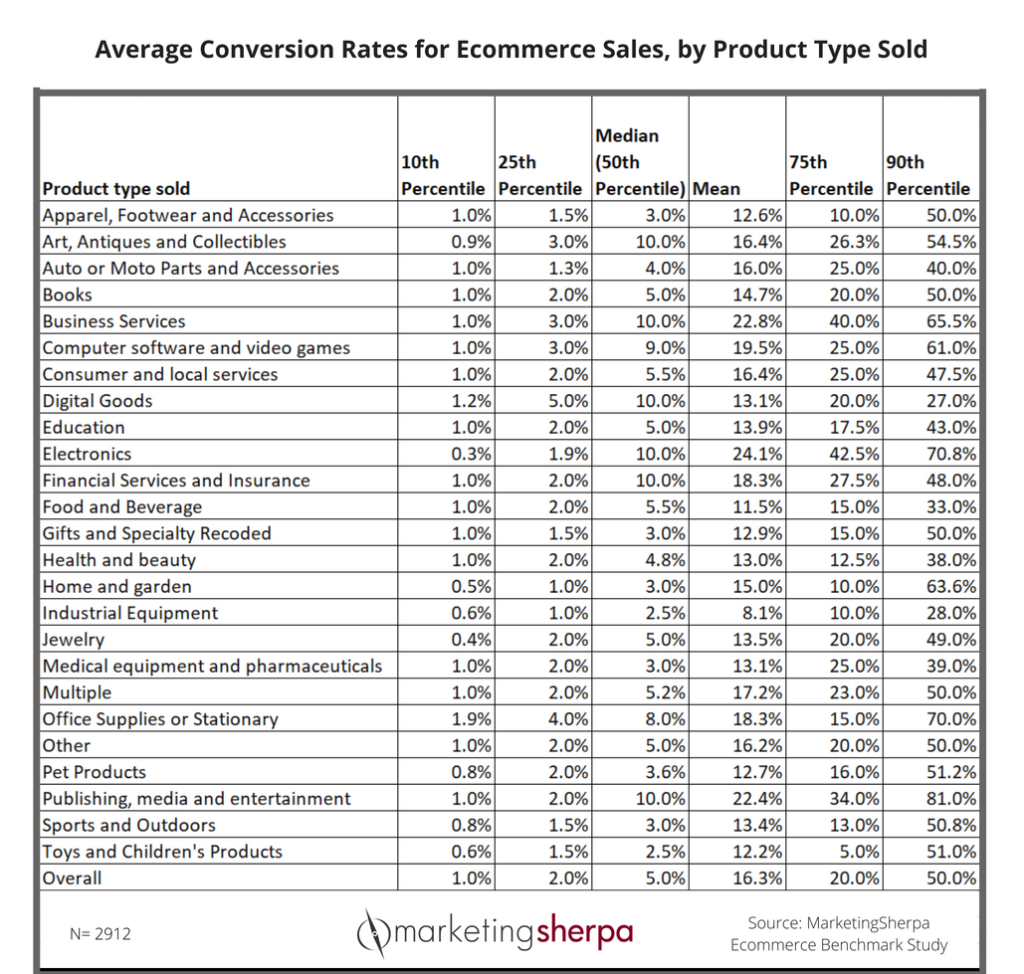
Let’s say you ran a clothing e-commerce store.
If you used the average (mean) conversion rate in the apparel vertical (12.6%), you’d be tempted to think that a 19% conversion rate is fantastic. After all, it’s over 50% better than average, right?
But the truth is that top apparel e-commerce stores are doing far better. E-commerce stores in the 90th percentile (or the top 10%), convert at 50% or above.
I’ve found this to be true for virtually every Pirate Metric (and their derivatives).
Moral of the story? When it comes to benchmarks, beware of averages.
Want More? This article is part of the UX Engineer Playbook series.